Winter Trend: Stable
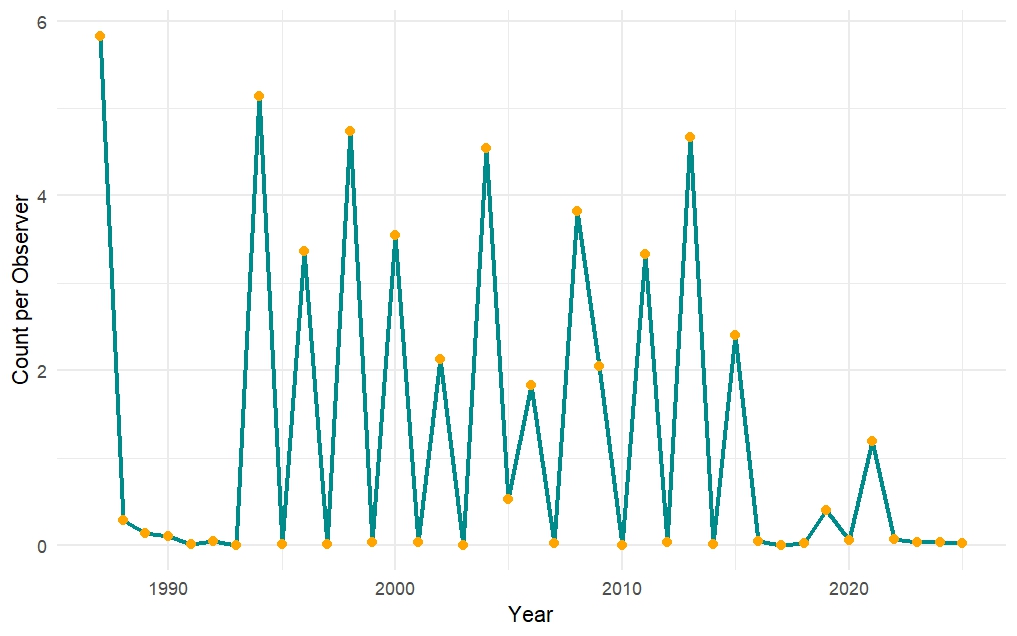
Redpoll Data 1987–2025
Redpoll data from the Backyard Winter Bird Survey (1987-2025). Each orange point shows the average number of Redpolls reported per observer in a given year. The blue line connects the points to highlight year-to-year changes.

What’s the Story?
Redpoll numbers fluctuate dramatically from year to year. They are an irruptive species, meaning their winter movements depend on food availability farther north. When seed crops are scarce, more Redpolls move south into New Hampshire. When seeds are abundant up north, fewer appear here. Their movements are especially tied to birch and spruce seed crops.
Our analysis of Backyard Winter Bird Survey data from 1987 to 2025 shows that Redpoll populations in New Hampshire are stable, with no significant long-term trend. That means the ups and downs you see are part of their normal cycle, rather than a sign of long-term decline.
Like American Goldfinches, Redpolls often show a biennial pattern, with irruptions every other year. But as you can see from the data, there are some major deviations from this pattern. The reasons for those unusual years are still a mystery.
Hoary and Common Redpolls were recently lumped into one species: the Redpoll. The “hoary” types are far less common and are a special find if you spot one.
Feeding Tips
- Redpolls readily visit feeders for sunflower chips and Nyjer.
- Offering multiple small feeders can help reduce crowding when flocks arrive all at once.

In Your Backyard
- Redpolls travel in large, energetic flocks—sometimes numbering in the hundreds. They often appear suddenly, feed frantically, and then vanish just as quickly.
- Watch for them dangling upside down on birch catkins.
- Keeping native, seed-producing trees like birches in your yard provides natural winter food when Redpolls irrupt into New Hampshire.

ID Tips
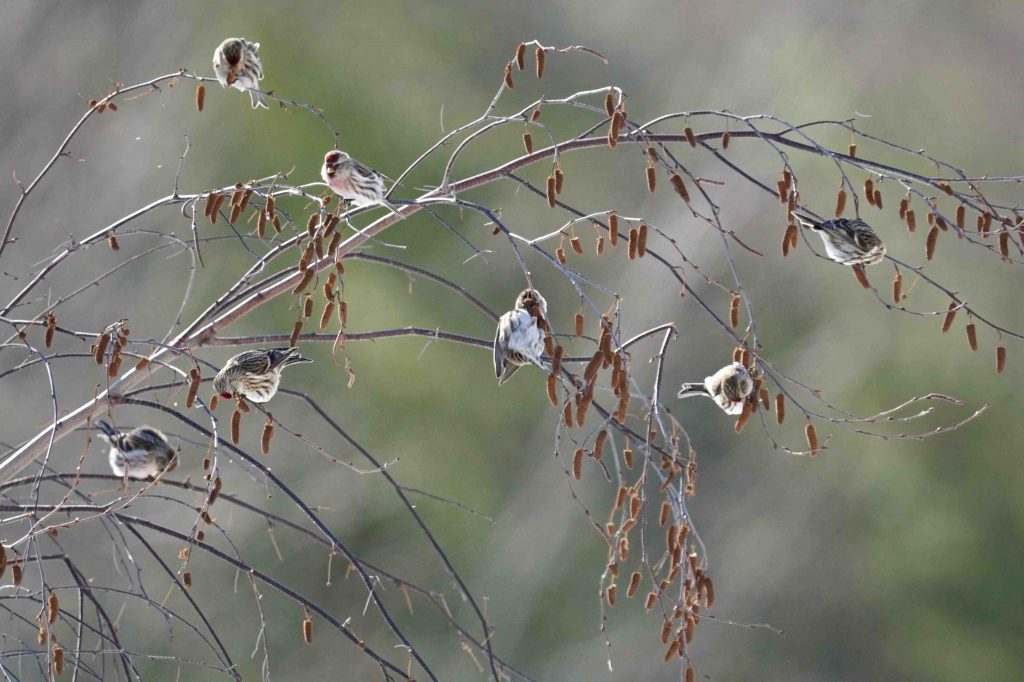
Redpolls by Grace McCulloch.
Redpolls are often seen in flocks. Looks for a small yellow bill, round body, notched tail, and a little red cap. They also have a little black marking on their faces.