Winter Trend: Increasing

Red-bellied Woodpecker, 1987–2025.
The dark purple line shows the trend over time predicted by our statistical model, while the shaded purple area shows where we are 95% confident the true trend lies. Gray points are the number of Red-bellied Woodpeckers actually observed in participants’ backyards, averaged per observer.

What’s the Story?
Over the past few decades, Red-bellied Woodpeckers have made a remarkable range expansion into New Hampshire. Prior to the early 2000s, they were considered rare here, but today they are regularly reported south of the White Mountains. Warmer winters and reforestation have likely helped this species move northward.
Our statistical analysis shows their remarkable and recent increase: a negative binomial regression shows a significant upward trend (β = 0.183 ± 0.009 SE, z = 20.62, p < 0.001).
This translates to reports of Red-bellied Woodpeckers increasing by about 20% per year, even when accounting for changes in the number of Backyard Winter Bird Survey participants over time.
Some researchers suggest that the widespread loss of elm trees to Dutch Elm Disease created opportunities for expansion by providing large dead trees with cavities suitable for nesting. The arrival of the invasive Emerald Ash Borer, which is decimating ash trees in New Hampshire, may also be benefiting this species by creating new foraging opportunities. Red-bellied Woodpeckers feed on insects found under tree bark.
Recent data suggest that their dramatic increase may be beginning to level off, with a possible plateau in recent years. We’ll continue to monitor this species closely, as such plateaus are often seen when range-expanding species reach the limits of suitable habitat.

Feeding Tips
- Suet feeders are an excellent choice for attracting woodpeckers in winter.
- Red-bellied Woodpeckers also visit feeders with black-oil sunflower seeds, peanuts, and mealworms.
- In summer, they enjoy orange halves, just like Baltimore Orioles!

In Your Backyard
- Red-bellied Woodpeckers are often found in or near forests. Backyards with large trees or that border wooded areas are more likely to attract them.
- Watch for Red-bellied Woodpeckers climbing along tree trunks and large branches, probing the bark for food.
- Keep large trees on your property to provide potential nesting habitat.

ID Tips
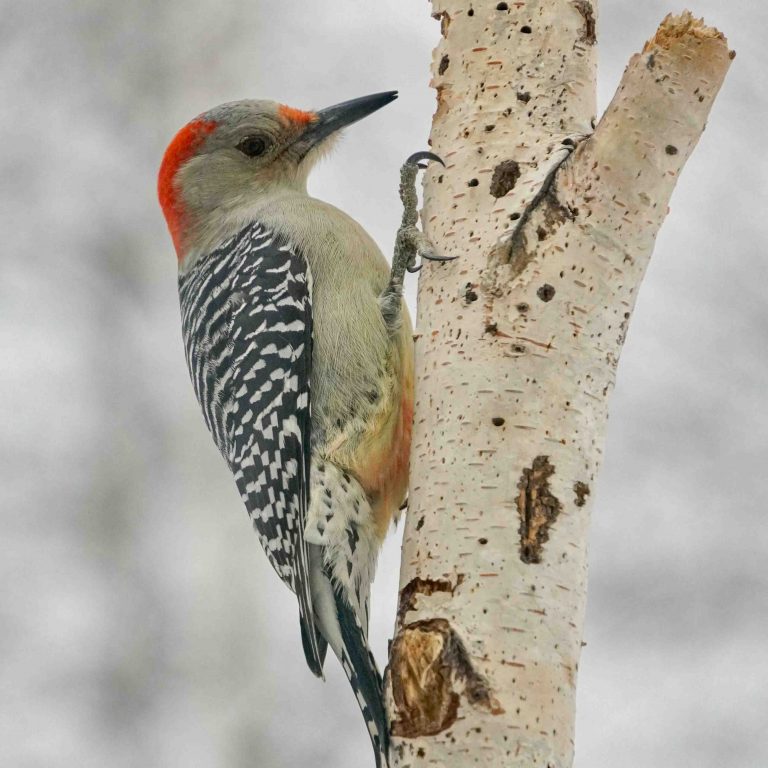
Female Red-bellied Woodpecker by Grace McCulloch.
Red-bellied Woodpeckers have a black-and-white barred back. The faint red wash on the belly (where the name comes from) is rarely visible. There is, however, always a red patch on the nape (back of the neck). The female is pictured above. The male has red on the top of the head too.

Look Alike Alert: Red-headed Woodpecker
Red-bellied Woodpeckers are sometimes mistaken for Red-headed Woodpeckers.
However, Red-headed Woodpeckers are very rare in New Hampshire, with only a few sightings each year. Be sure to double-check that the bird isn’t a Pileated or Red-bellied Woodpecker. If you think you’ve spotted a Red-headed Woodpecker, snap a photo and send it to us to confirm your rare sighting.
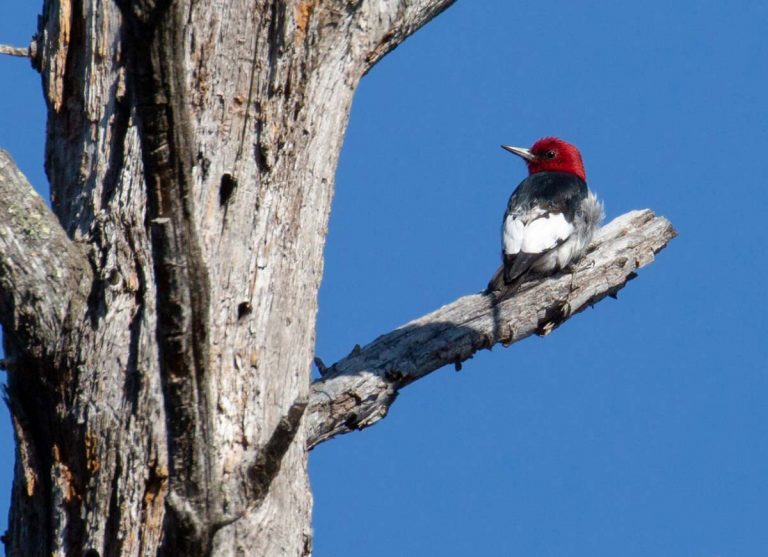
Red-headed Woodpecker by Len Medlock.