
What’s the Story?

Feeding Tips

In Your Backyard
ID Tips

Look Alike Alert: House Finch
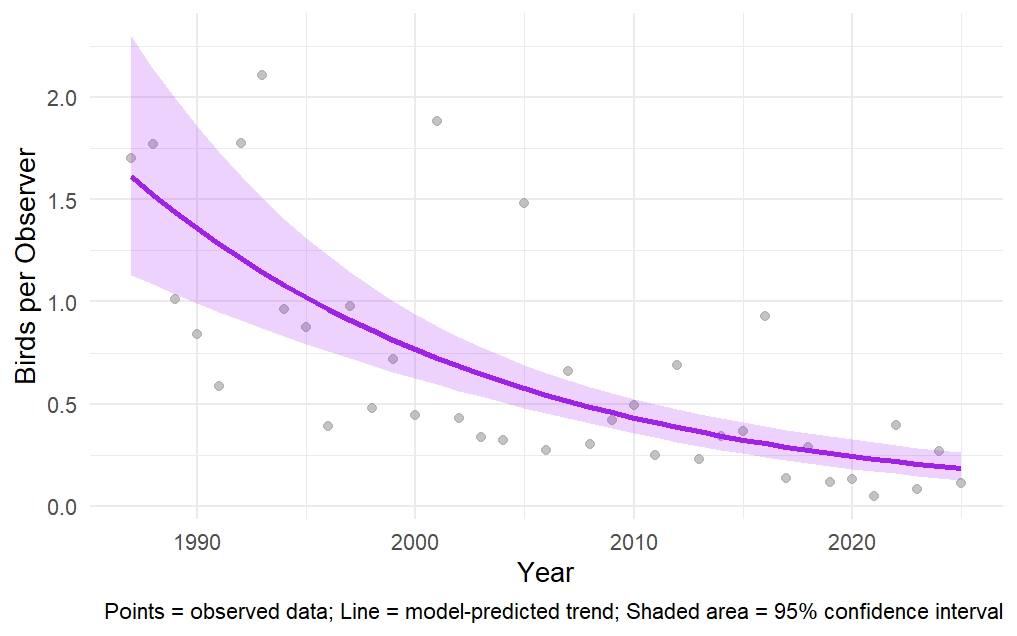
Purple Finch, 1987–2025.
The dark purple line shows the trend over time predicted by our statistical model, while the shaded purple area shows where we are 95% confident the true trend lies. Gray points are the number of Purple Finches actually observed in participants’ backyards, averaged per observer.
The Purple Finch, New Hampshire’s state bird, is an iconic species in our forests and backyards. Purple Finches are considered an irruptive species, meaning their winter numbers fluctuate depending on food supplies farther north. In years when food is abundant in Canada, few make their way south. Yet when food is scarce, large numbers may move into New Hampshire, feeding on conifer seeds and other available resources.
Our analysis of the Backyard Winter Bird Survey shows a troubling trend: a negative binomial regression reveals a significant downward trajectory (β = -0.057 ± 0.008 SE, z = -6.993, p < 0.001).
This translates to reports of Purple Finches decreasing by about 6% per year, even when accounting for changes in the number of Backyard Winter Bird Survey participants over time.
A similar decline has been seen in eBird Status and Trends data with a decline of 13.9% from 2012-2022 in New Hampshire. Interestingly, this same dataset shows an increase in other areas of their range including parts of Canada to our north (see the map here).
Purple Finches are often confused with the more common House Finch. Before House Finches expanded into the region, Purple Finches were widespread in New Hampshire. However, research suggests that competition with the non-native House Finch may be contributing to declines, with both species vying for food and nesting sites.
Climate change may pose an additional threat. Since New Hampshire lies at the southern edge of the Purple Finch’s breeding range, warming temperatures could further reduce suitable habitat for this species.
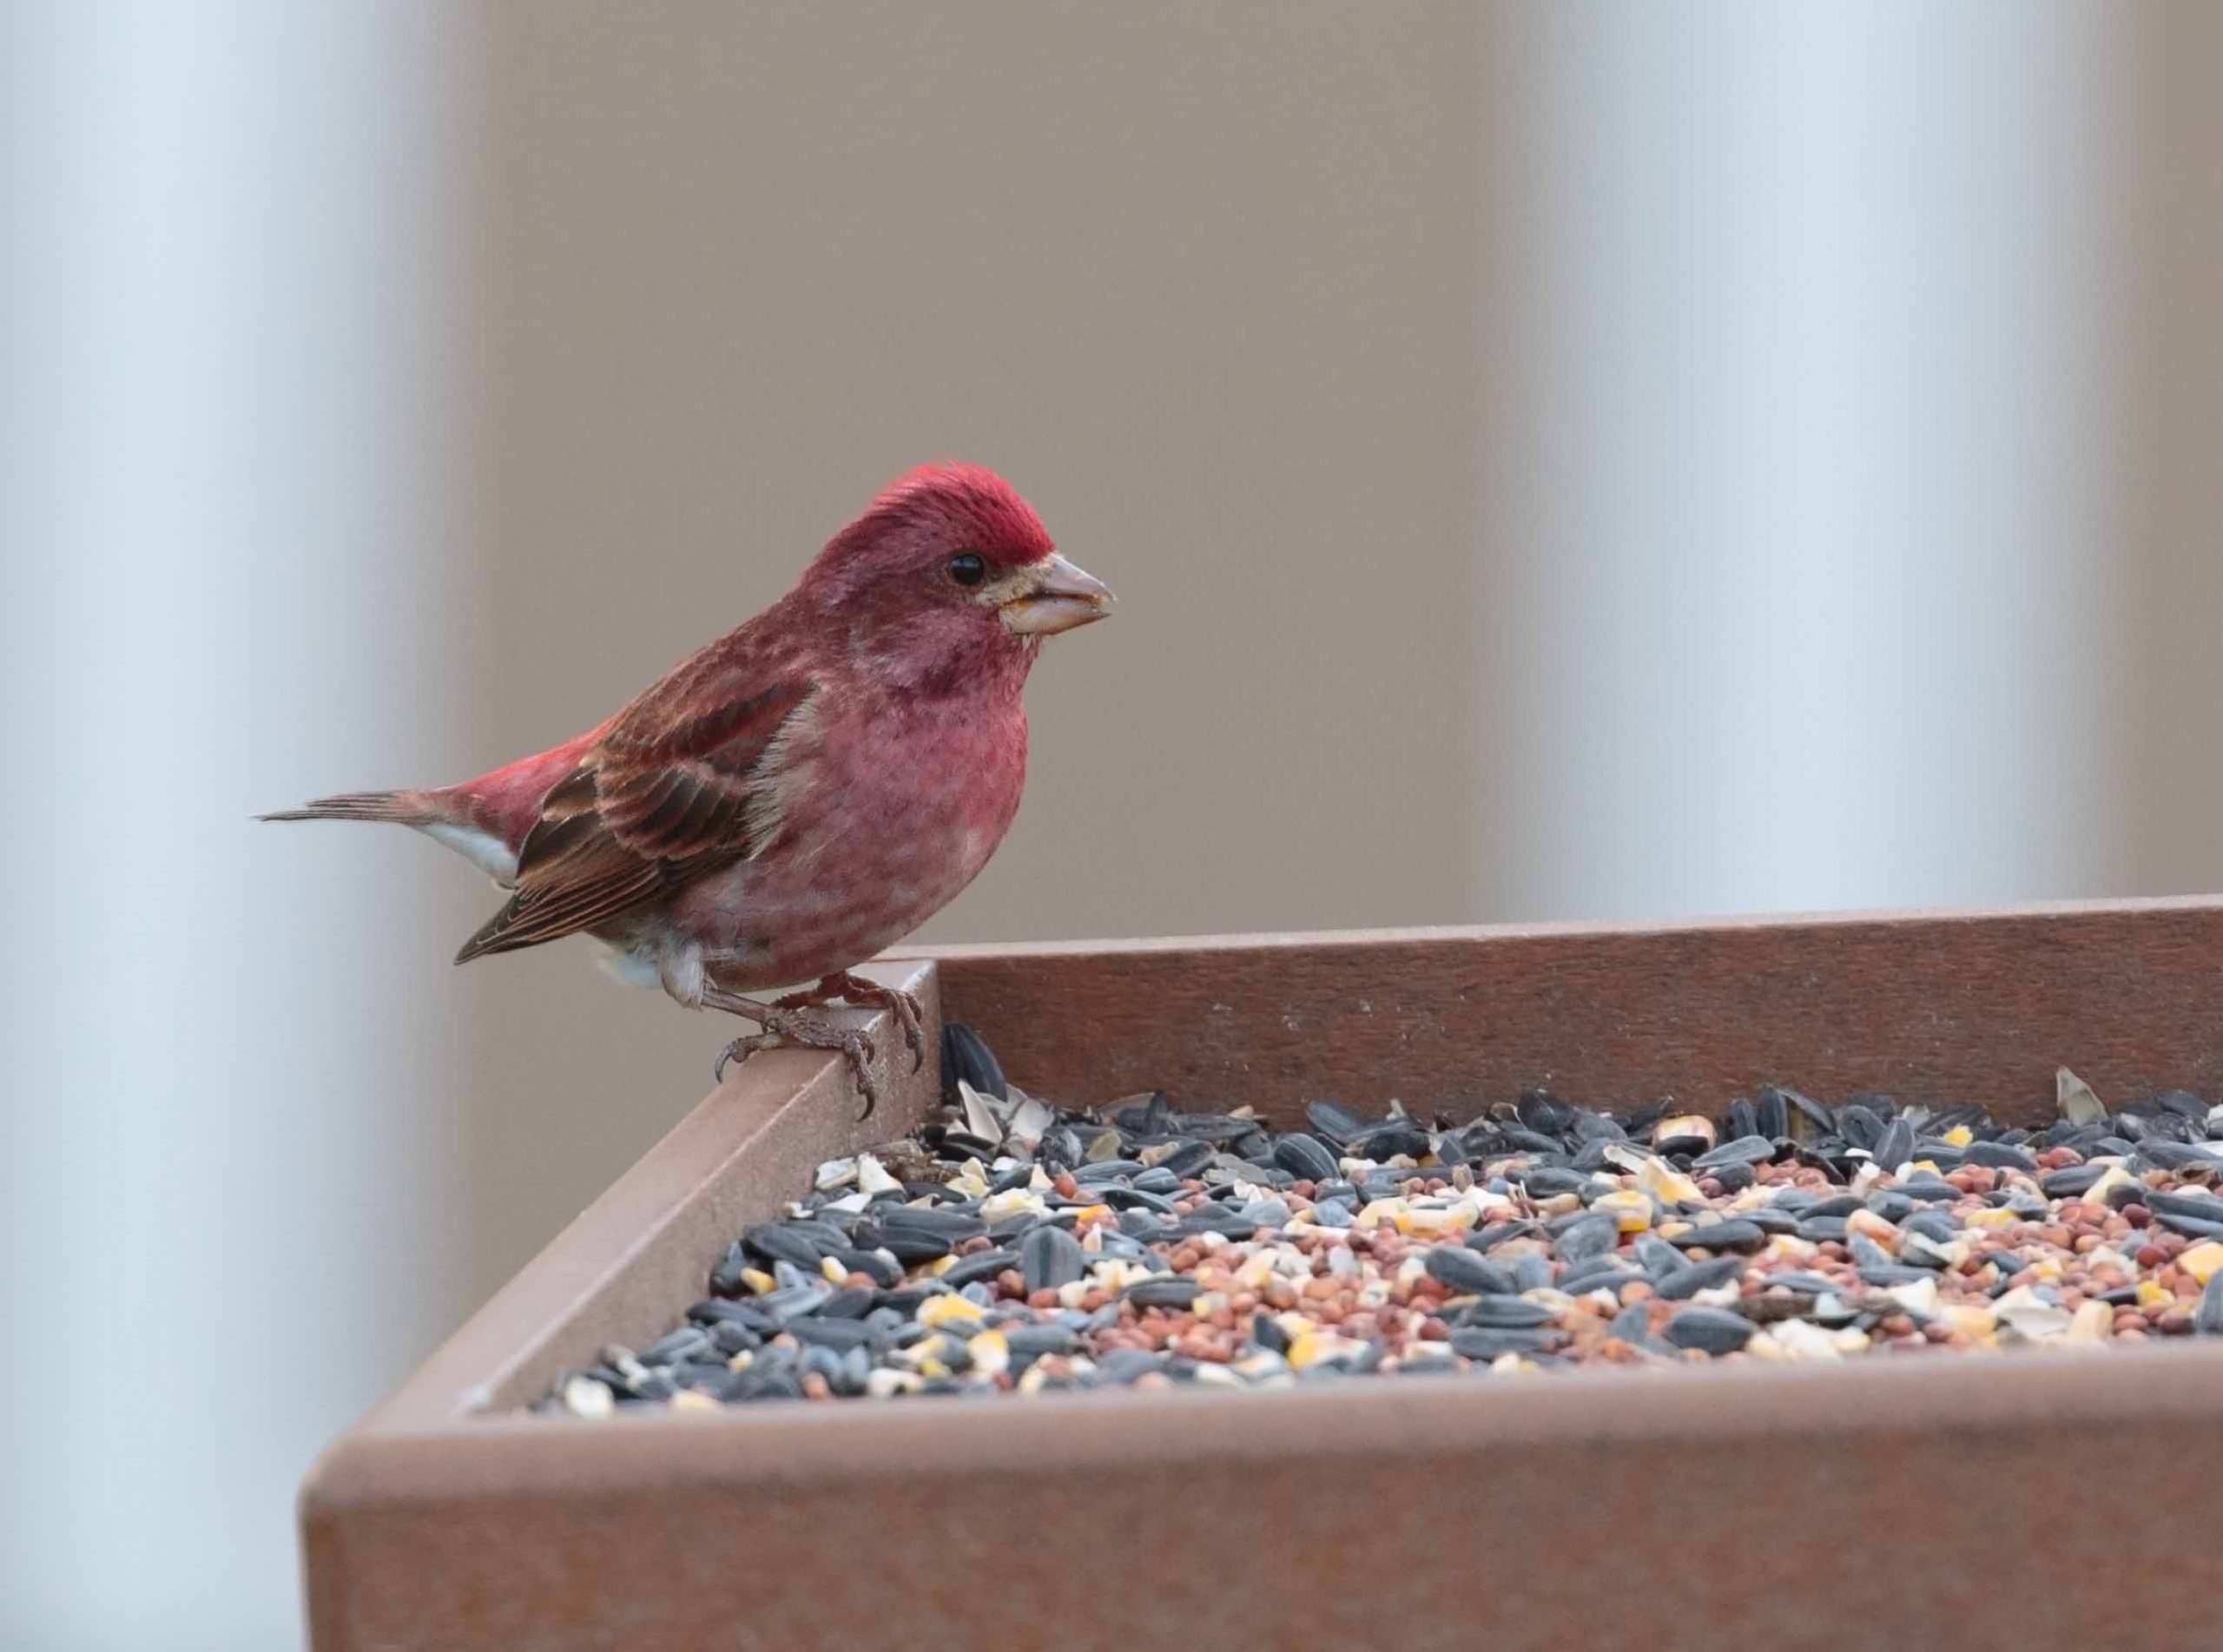
Male Purple Finch by Len Medlock.
Male Purple Finches appear to have been “dipped in raspberry juice” with purple on the head and back. They also have less streaking on the back than the House Finch. Both sexes have a deeply notched tail.
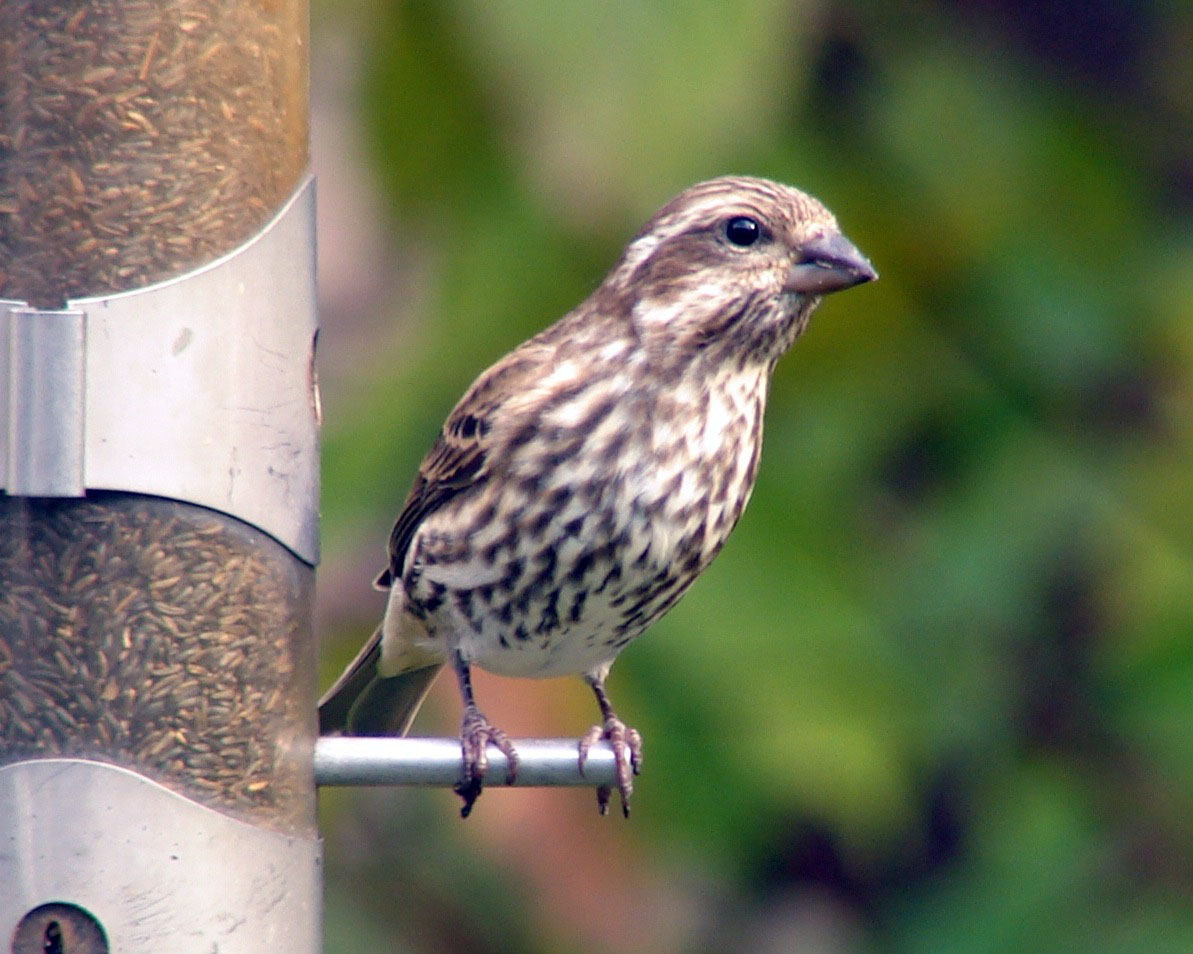
Female Purple Finch by Pam Hunt
Female Purple Finches are brown with a white stripe above the eye.
House Finches can be confused with Purple Finches. If you spot a Purple Finch south of the White Mountains, remember to take a closer look.
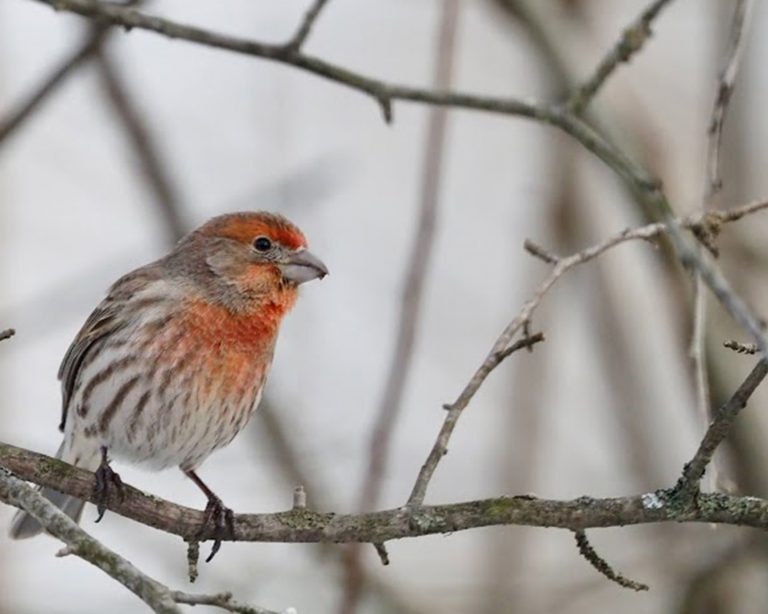
Male House Finch by Caitlin McMonagle, 2024 Backyard Winter Bird Survey.
Male House Finches are fire engine red on the head, breast, and rump. However, they have brown on much of their back. Both sexes have a more squared off tail.
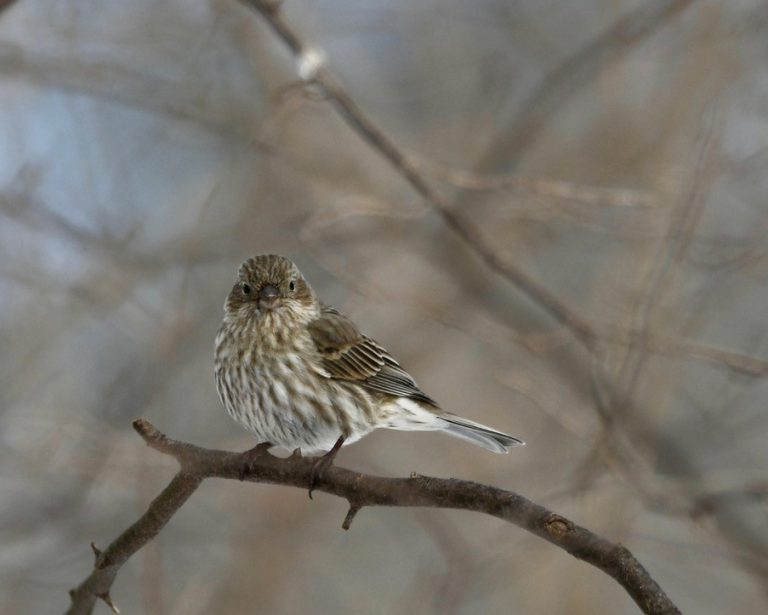
House Finch by Rebecca Scott, 2025 Backyard Winter Bird Survey.
Female House Finches are all brown.
Observed Data (gray points):
The average number of birds counted per participant each year.
Model-Predicted Trend (dark purple line):
A line from a statistical model that estimates the overall trend in bird numbers over time, smoothing out year-to-year fluctuations.
95% Confidence Interval (shaded purple area):
The range around the predicted trend where we are 95% confident the true trend lies. Gray points inside this band indicate observations that are consistent with the predicted trend.
Other Stats You Might See in the Story:
The Takeaway: These graphs show how bird populations are changing over time. The model helps us see the overall trend and the confidence interval shows how certain we are about that trend.