Winter Trend: Decreasing
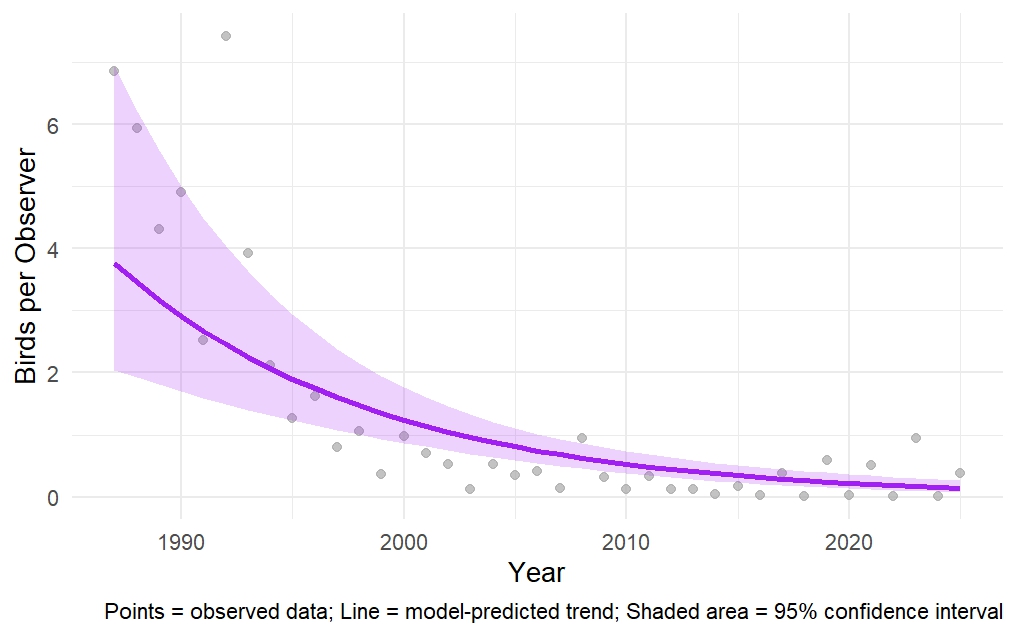
Evening Grosbeak, 1987–2025.
The dark purple line shows the trend over time predicted by our statistical model, while the shaded purple area shows where we are 95% confident the true trend lies. Gray points are the number of Evening Grosbeaks actually observed in participants’ backyards, averaged per observer.

What’s the Story?
If you were birding in New Hampshire during the 1980s and early 1990s, you likely remember the days when dozens of Evening Grosbeaks crowded backyard feeders across the state. Today, their numbers are dramatically lower. Globally, Evening Grosbeaks have declined by 92% since 1970 (learn more at the Finch Research Network ).
Backyard Winter Bird Survey data show a similar trend. A negative binomial regression reveals a significant downward trend (β = -0.086 ± 0.014 SE, z = -6.060, p < 0.001).
This translates to reports of Evening Grosbeaks deceasing by about 8% per year, even when accounting for changes in the number of Backyard Winter Bird Survey participants over time.
Evening Grosbeak numbers in New Hampshire are closely tied to spruce budworm outbreaks in eastern Canada, which occur roughly every 40 years. When spruce budworm is abundant, Evening Grosbeak populations can spike dramatically. You can see the last peak at the end of the most recent outbreak in the graph.
As an irruptive species, their numbers also fluctuate widely from year to year. In New Hampshire, most individuals are winter visitors from breeding grounds in Canada, with only a few local breeding records. Whether Evening Grosbeaks will rebound to their former abundance remains uncertain, though if the historical pattern holds, another spruce budworm outbreak may bring a resurgence.

Feeding Tips
- Evening Grosbeaks love sunflower seeds, from black oil to chips.
- They will readily feed at both hanging feeders and platforms.

In Your Backyard
- Highly social, Evening Grosbeaks are often seen in large, noisy flocks.
- Planting native shrubs and trees that hold fruit into the winter can provide valuable natural food.
- Since Evening Grosbeaks can consume large amounts of seed quickly, consider offering seed in multiple feeders to reduce crowding and competition.
- Today, Evening Grosbeaks are more likely in northern New Hampshire, with few reports south of the White Mountains.

ID Tips
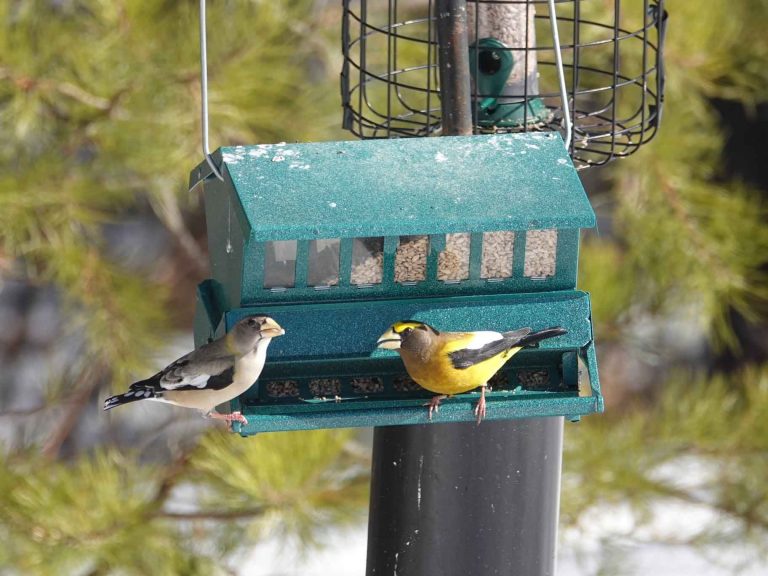
Evening Grosbeaks by David Govatski, 2023 Backyard Winter Bird Survey.
Evening Grosbeaks are large finches with thick, conical bills. Males (right) are strikingly yellow and black, with bold white wing patches and a yellow eyebrow. Females (left) are more subdued, mostly gray with a soft yellow wash on the neck.

Look Alike Alert: American Goldfinch
American Goldfinches can sometimes be mistaken for Evening Grosbeaks. Remember, Evening Grosbeaks have a much thicker bill and stockier body. American Goldfinches are also far more common throughout much of New Hampshire.
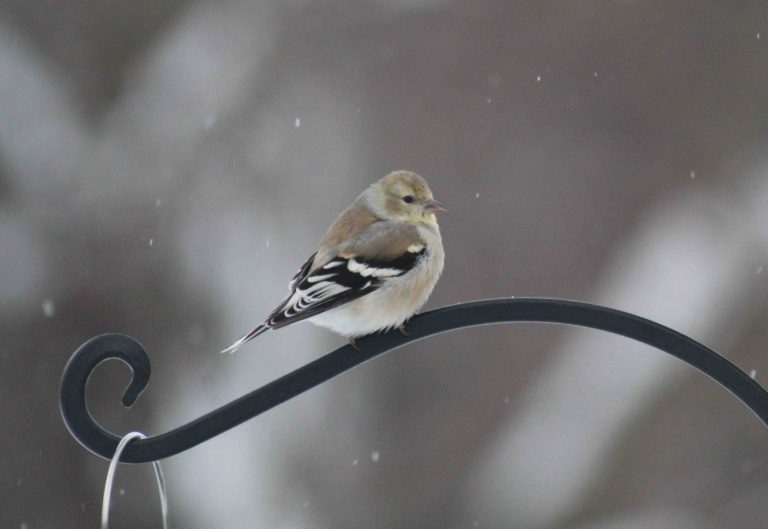
American Goldfinch by Aubrie Giroux, 2025 Backyard Winter Bird Survey.
American Goldfinches have a much different plumage in winter. Look for a small bird in muted yellow/brown in winter with black on wings and buffy/yellow wing bars.