Winter Trend: Decreasing
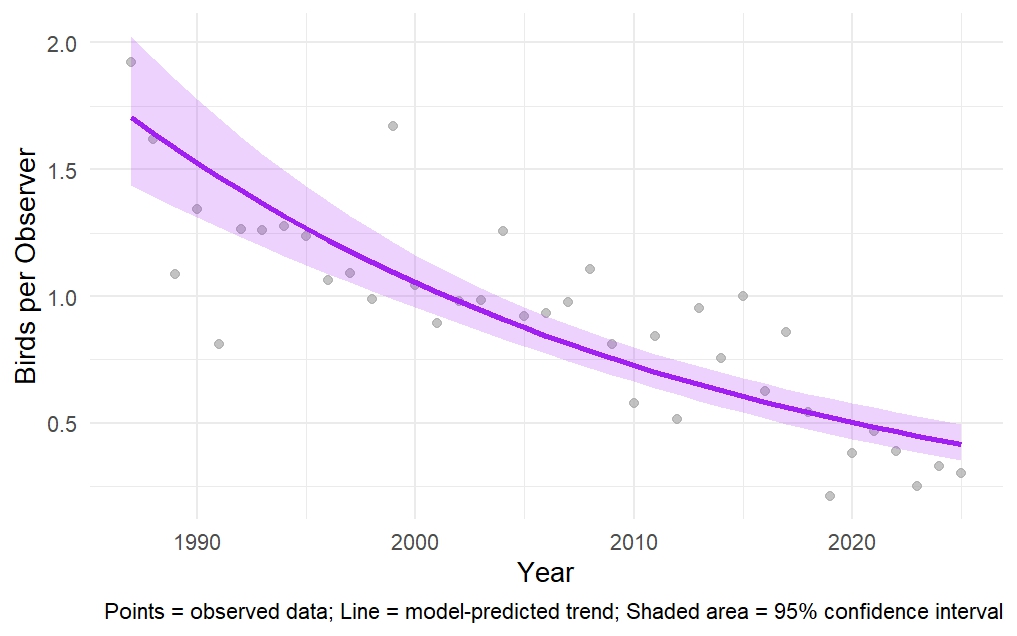
American Tree Sparrow Winter Trend 1987–2025
American Tree Sparrow, 1987–2025. The dark purple line shows the trend over time predicted by our statistical model, while the shaded purple area shows where we are 95% confident the true trend lies. Gray points are the number of American Tree Sparrows actually observed in participants’ backyards, averaged per observer.

What’s the Story?
Despite their name, American Tree Sparrows aren’t year-round residents. American Tree Sparrows migrate from the Arctic to spend the winter in the US. Nicknamed the “Winter Chippy” for their resemblance to Chipping Sparrows, they can be distinguished by a few key field marks (see below).
Our statistical analysis shows a decrease in the number of American Tree Sparrows reported in recent decades: a negative binomial regression reveals a significant downward trend (β = -0.037 ± 0.004 SE, z = -9.346, p < 0.001).
This translates to reports of American Tree Sparrows deceasing by about 4% per year, when accounting for changes in the number of Backyard Winter Bird Survey participants over time.
Why the decline? The answer is complex and likely reflects changes happening on a national scale. Widespread land-use changes have reduced overwintering habitat. In the West, agricultural intensification has eliminated much of their preferred habitat, open weedy fields and shrubby areas. In New England, many weedy fields have matured into forests, further shrinking available winter habitat.

Feeding Tips
- American Tree Sparrows eat a variety of seeds, including black oil sunflower, Nyjer, and peanut hearts.
- Platform feeders work well for this species, which often prefers to feed on the ground.

In Your Backyard
- American Tree Sparrows often travel in small flocks during winter.
- Look for them in weedy fields and shrubby areas. Leaving natural seed sources, like dead seed heads, can provide valuable winter food.

ID Tips
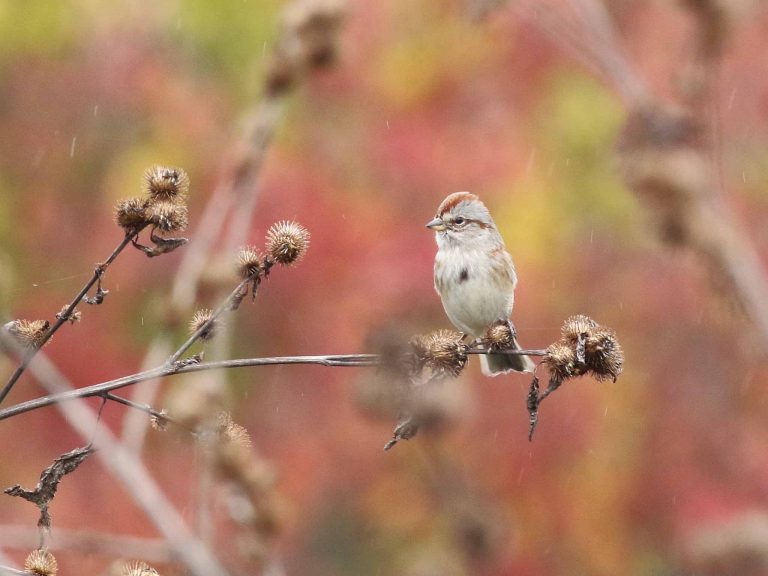
American Tree Sparrow by Steve Mirick.
American Tree Sparrow with a rusty cap, gray line above the eye with a small rusty line through the eye. Their gray/white breast sometimes has a spot.

Look Alike Alert: Chipping Sparrow
The American Tree Sparrow is sometimes referred to as the “Winter Chipping Sparrow.” In winter Chipping Sparrows are very rare in New Hampshire. Chipping sparrows in winter plumage look quite different to the summer plumage we are used to. Below is a photograph of a Chipping Sparrow in winter.
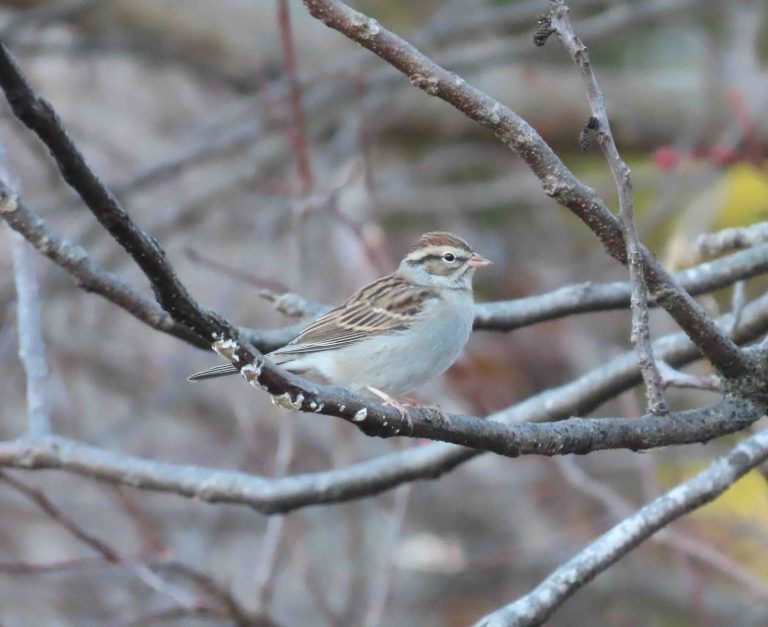
Chipping Sparrow in winter plumage by Pam Hunt.
Pay attention to the brown cap, dull white line above the eye, and the white/gray breast with no spot of the winter Chipping Sparrow. When in doubt you can always send us a photo or report the bird as Sparrow sp..