Winter Trend: Increasing

American Robins, 1987–2025.
The dark purple line shows the trend over time predicted by our statistical model, while the shaded purple area shows where we are 95% confident the true trend lies. Gray points are the number of robins actually observed in participants’ backyards, averaged per observer.

What’s the Story?
American Robins were once considered a sign of spring, but that’s changing. Today, American Robins overwinter across much of New Hampshire, though they are less common in Coos County and the White Mountains. Large flocks are now commonly seen even in the dead of winter.
Our statistical analysis confirms this increase: a negative binomial regression shows a significant upward trend (β = 0.108 ± 0.014 SE, z = 7.801, p < 0.001).
This translates to reports of robins increasing by about 11% per year, even when accounting for changes in the number of Backyard Winter Bird Survey participants over time.
This increase is likely due to a combination of warmer winters and more ornamental fruit trees in yards and landscapes. These ornamental trees provide fruit through the winter, a key component of their diet. Slightly warmer winters also benefit this species that’s range had previously been limited by cold and snow cover.
Feeding Tips
- Dried mealworms are a favorite food of American Robins at feeders in winter.
- Robins will also eat raisins, currants, dried figs, and other dried fruit softened in warm water for 20–30 minutes and placed on a flat surface.
- Robins don’t typically feed at hanging feeders; offer food on a table or feeder platform instead.
- American robins will also feed at suet feeders.
In Your Backyard
- Look for large flocks of robins in areas with abundant fruit-bearing shrubs or trees like sumac, holly, and crabapple.
- Providing unfrozen water in a birdbath can be a welcome resource for drinking and bathing.
- Leave a little mess in the garden. Unraked leaves and debris can create additional foraging opportunities.

ID Tips
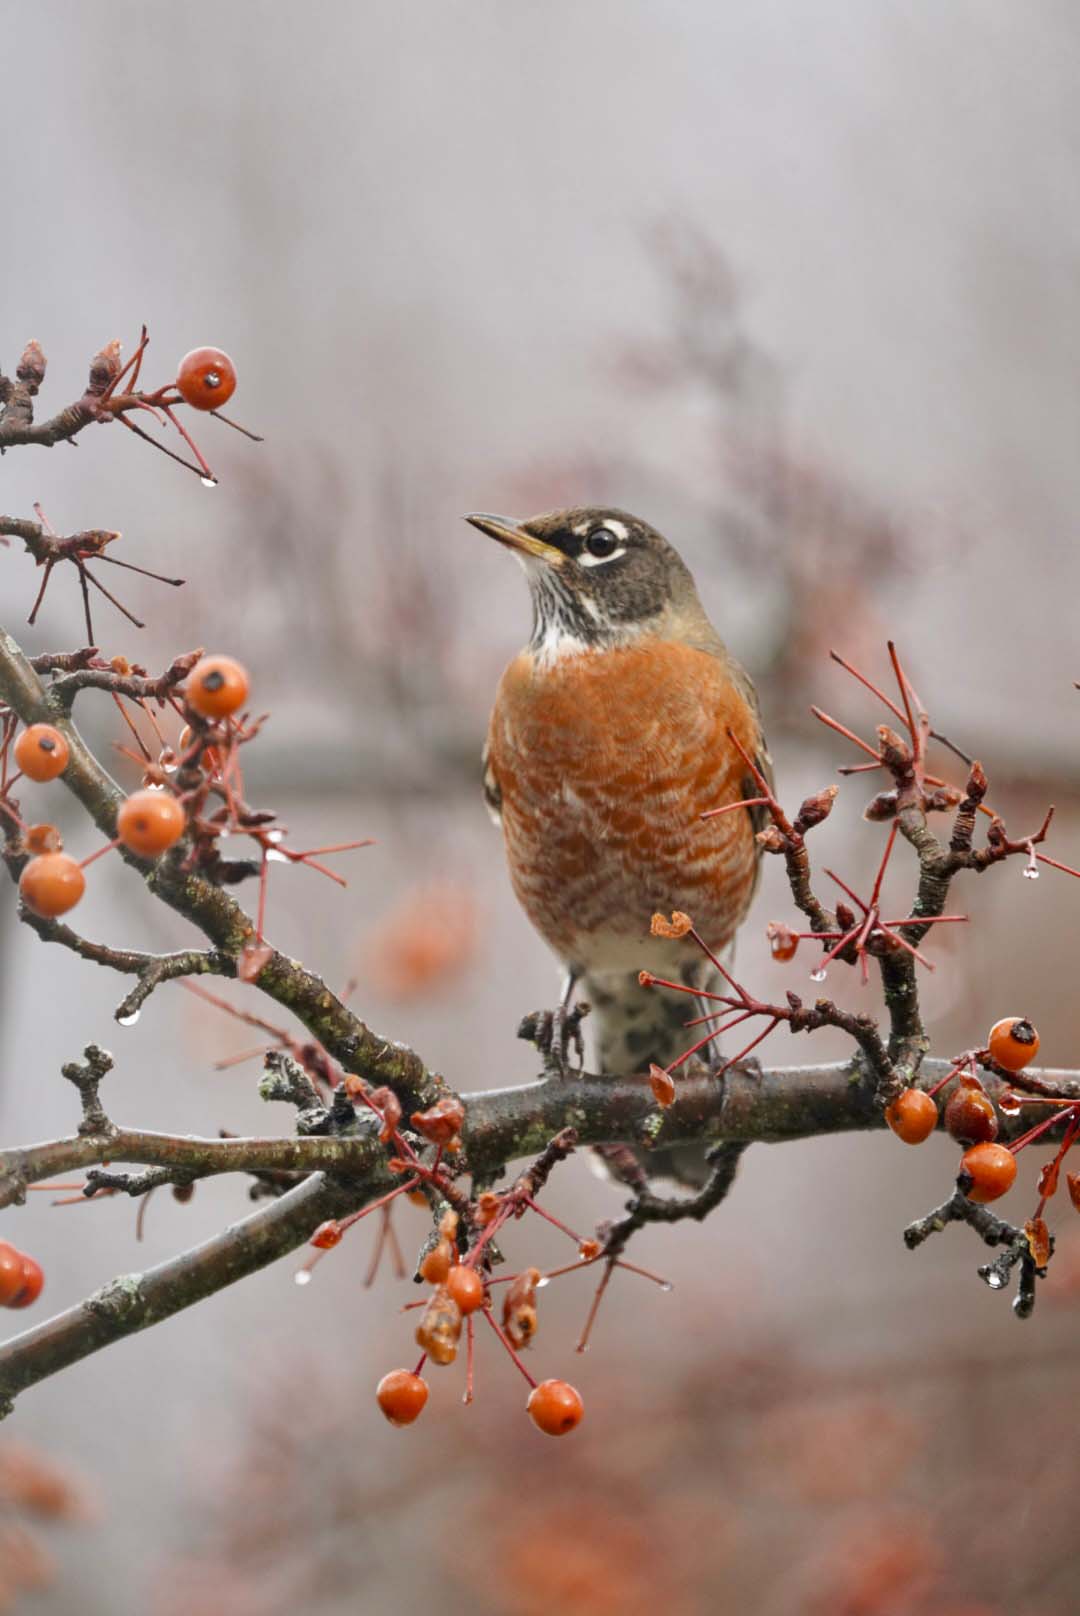
American Robin by Grace McCulloch.
Larger than most songbirds, American Robins have gray on the back and orange breasts. Also, look for the dark head with a white eye-ring