Winter Trend: Uncertain
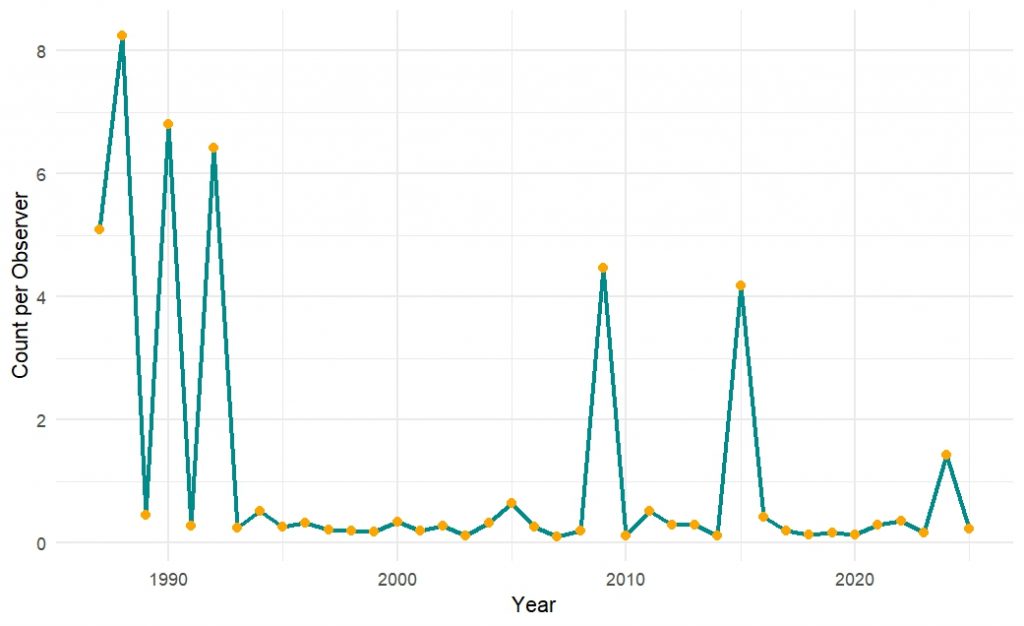
Pine Siskin Data 1987–2025
Pine Siskin data from the Backyard Winter Bird Survey (1987-2025). Each orange point shows the average number of Pine Siskins reported per observer in a given year. The blue line connects the points to highlight year-to-year changes.

What’s the Story?
Pine Siskins are irruptive winter finches. Some years they’re everywhere and other years they’re nowhere to be found. Do you remember the irruption of Pine Siskins in 2024?
Pine Siskins are among the most unpredictable species in the Backyard Winter Bird Survey. Their numbers rise and fall dramatically depending on conifer cone and birch seed crops across the boreal forest. When food is scarce up north, Pine Siskins move south (to us) in search of food, leading to major irruptions in some years and near-absence in others.
Our analysis of Backyard Winter Bird Survey data from 1987–2025 suggests a slight decline, but because these large natural fluctuations strongly influence the data, it’s difficult to draw conclusions about long-term population trends. The graph above shows the raw counts to highlight this variability rather than a fitted trend.
Feeding Tips
- Pine Siskins love thistle and Nyjer seed. They’ll also feed on sunflower chips and black-oil sunflower seeds.
- Maintaining trees such as pine, hemlock, birch, and spruce provides natural food sources. Watch for Pine Siskins clinging to cones or branches as they feed.

In Your Backyard
- Pine Siskins travel in large, chattering flocks.
- You may spot them in unexpected places, such as along road edges picking up mineral deposits.
- Though they’re typically associated with conifer forests, during irruption years they can turn up almost anywhere (including backyards) taking advantage of available seed sources.

ID Tips
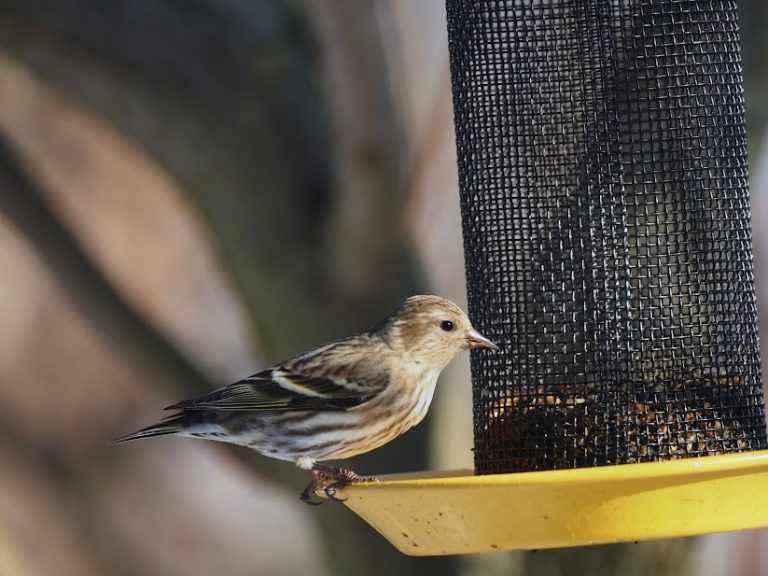
Pine Siskin by Caitlin McMonagle, 2024 Backyard Winter Bird Survey.
Look for a short, notched tail and a thin pointed bill. Pine Siskins are heavily streaked with yellow sometimes showing on the wings and tail.