Winter Trend: Decreasing
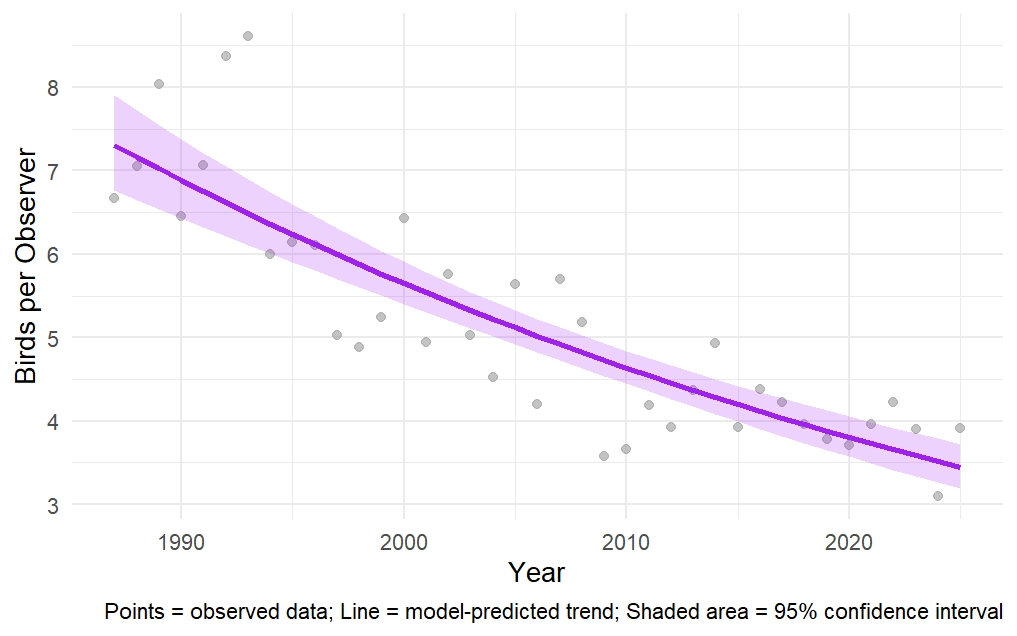
Mourning Dove, 1987–2025.
The dark purple line shows the trend over time predicted by our statistical model, while the shaded purple area shows where we are 95% confident the true trend lies. Gray points are the number of Mourning Doves actually observed in participants’ backyards, averaged per observer.

What’s the Story?
Mourning Doves are a familiar backyard bird across many landscapes, thriving in both urban and rural areas. Yet, there was a time when they were absent from New Hampshire. The species first expanded into southeastern New Hampshire in the early 1900s, but it wasn’t until much later that they began staying through the winter. As the population grew, more Mourning Doves stopped migrating south, and by the late 20th century they had become year-round residents. Their numbers leveled off in the early 2000s and now appear to be in a slight decline. Status and Trends data from eBird show a 12.7% decline in New Hampshire from 2012-2022 (see the map here).
Our analysis of the Backyard Winter Bird Survey reveals a similar pattern: a negative binomial regression reveals a significant downward trend (β = -0.019 ± 0.002 SE, z = -11.02, p < 0.001).
This translates to reports of Mourning Doves deceasing by about 2% per year, even when accounting for changes in the number of Backyard Winter Bird Survey participants each year.
Despite these declines, Mourning Doves remain widespread across New Hampshire. They are considered partial migrants, with some individuals heading south for the winter while others stay. Supplemental feeding at backyard feeders can help support local birds. Their history in the state—a dramatic expansion, followed by stabilization and recent contraction—offers an important reminder that even our most familiar birds can experience significant long-term change.

Feeding Tips
- Mourning Doves feed primarily on the ground or on platform feeders.
- Mourning Doves are often seen beneath hanging feeders, cleaning up seeds tossed aside by other birds. At (or below) feeders they enjoy a wide variety of seeds, from millet and black oil sunflower to Nyjer and cracked corn.

In Your Backyard
- When not feeding, Mourning Doves often perch on telephone wires or in large trees.
- Mourning Doves also forage in open areas with bare ground, where they search for seeds or pick up grit to aid digestion.

ID Tips
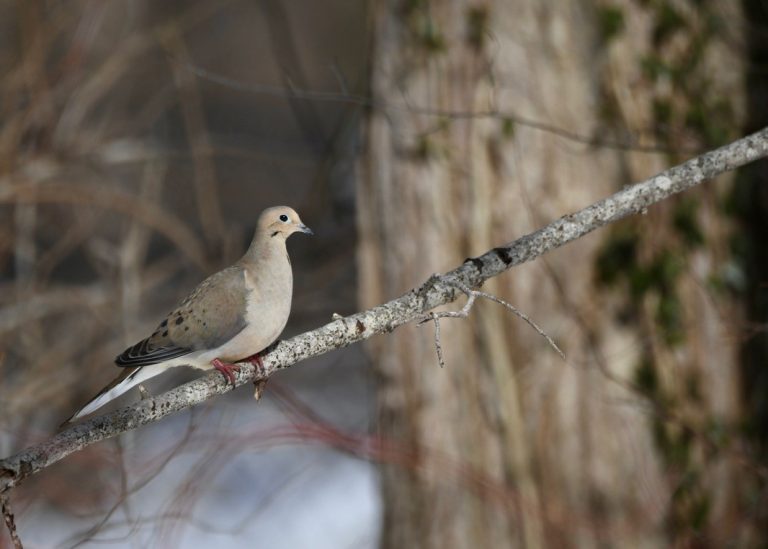
Mourning Dove by Rebecca Scott on the 2025 Backyard Winter Bird Survey.
Look for the slender body of the Mourning Dove with a more gray, brown appearance than a Rock Pigeon (or your common city pigeon). They have long tails with white tips seen in flight. Their cooing often mistaken for an owl.