Winter Trend: Decreasing
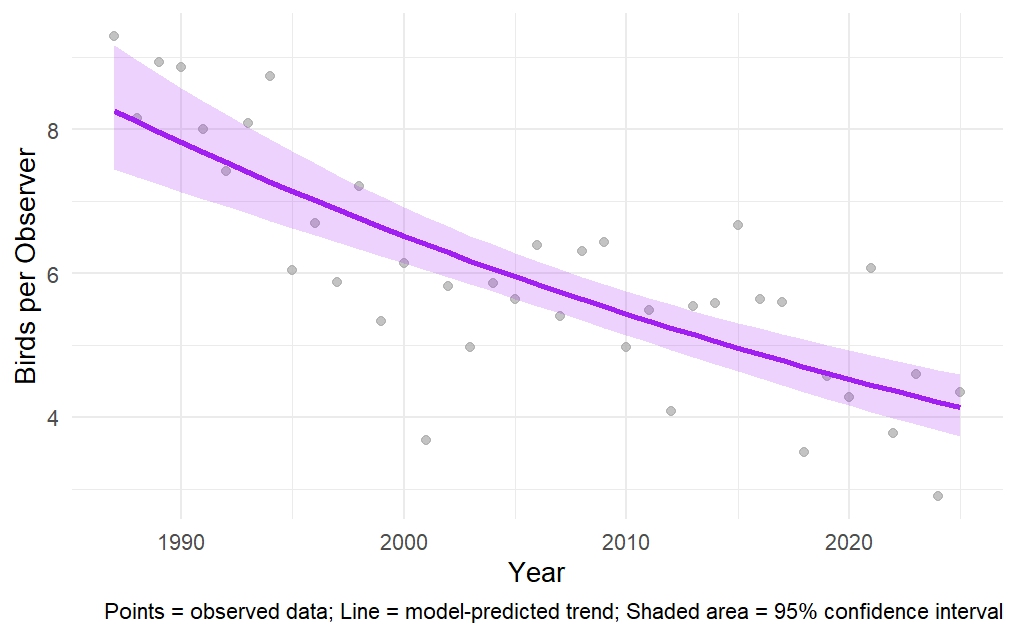
Black-capped Chickadee Winter Trend 1987–2025
Black-capped Chickadee, 1987–2025. The dark purple line shows the trend overtime predicted by our statistical model, while the shaded purple area shows where we are 95% confident the true trend lies. Gray points are the number of Black-capped Chickadees actually observed in participants’ backyards, averaged per observer.

What’s the Story?
Did you know that the chickadees at your feeder in winter might not be the same ones you see in summer? Chickadees can make small movements to other areas in search of food meaning “your” winter chickadees may actually differ from “your” summer chickadees. These small seasonal movements can explain some local changes in chickadee numbers at feeders.
However, recent data suggests Black-capped Chickadees are declining. Status and Trends data from eBird suggest an 18% decline in Black-capped Chickadee abundance from 2011-2021 here in New Hampshire (see the map here).
Our analysis of the Backyard Winter Bird Survey shows a similar pattern: a negative binomial regression reveals a significant downward trend (β = -0.018 ± 0.002 SE, z = -7.564, p < 0.001).
This translates to reports of Black-capped Chickadees deceasing by about 2% per year, even when accounting for changes in the number of Backyard Winter Bird Survey participants over time.
Why the decline? Several factors may be at play. Chickadee numbers naturally fluctuate, as shown by year-to-year variation in the graph. This is why long-term datasets are so valuable for separating short-term shifts from true trends. However, other pressures are likely contributing. Climate change is expected to reduce suitable habitat for Black-capped Chickadees, driving long-term declines (Rodenhouse et al. 2008 ). Forest fragmentation has been shown to negatively affect chickadee populations by reducing available nesting habitat and increasing vulnerability to predators (Foote et al. 2020).
Another emerging issue is hybridization. Black-capped Chickadees are known to interbreed with Carolina Chickadees farther south, and climate change is expected to shift that hybrid zone northward, potentially altering Black-capped Chickadee distribution in New England (check out this article to learn more). Finally, like many New England birds, chickadees face everyday risks from habitat loss, outdoor cats, and window collisions.
We will continue tracking Black-capped Chickadees and other winter birds through the Backyard Winter Bird Survey to better understand these changes. Even our most familiar feeder friends have important stories to tell, and your reports help us uncover them.

Feeding Tips
- Black-capped chickadees love black oil sunflower seeds.
- They will also feed on sunflower chips, safflower, and suet.

In Your Backyard
- Chickadees are common visitors to bird feeders and thrive in human-dominated areas with trees.
- Plant native trees and shrubs to provide cover and natural foraging opportunities. Native shrubs also support caterpillars, a vital summer food source for chickadee nestlings.
- Consider adding a nest box. Chickadees are cavity nesters, and with fewer large trees available, boxes can provide important nesting sites.

ID Tips
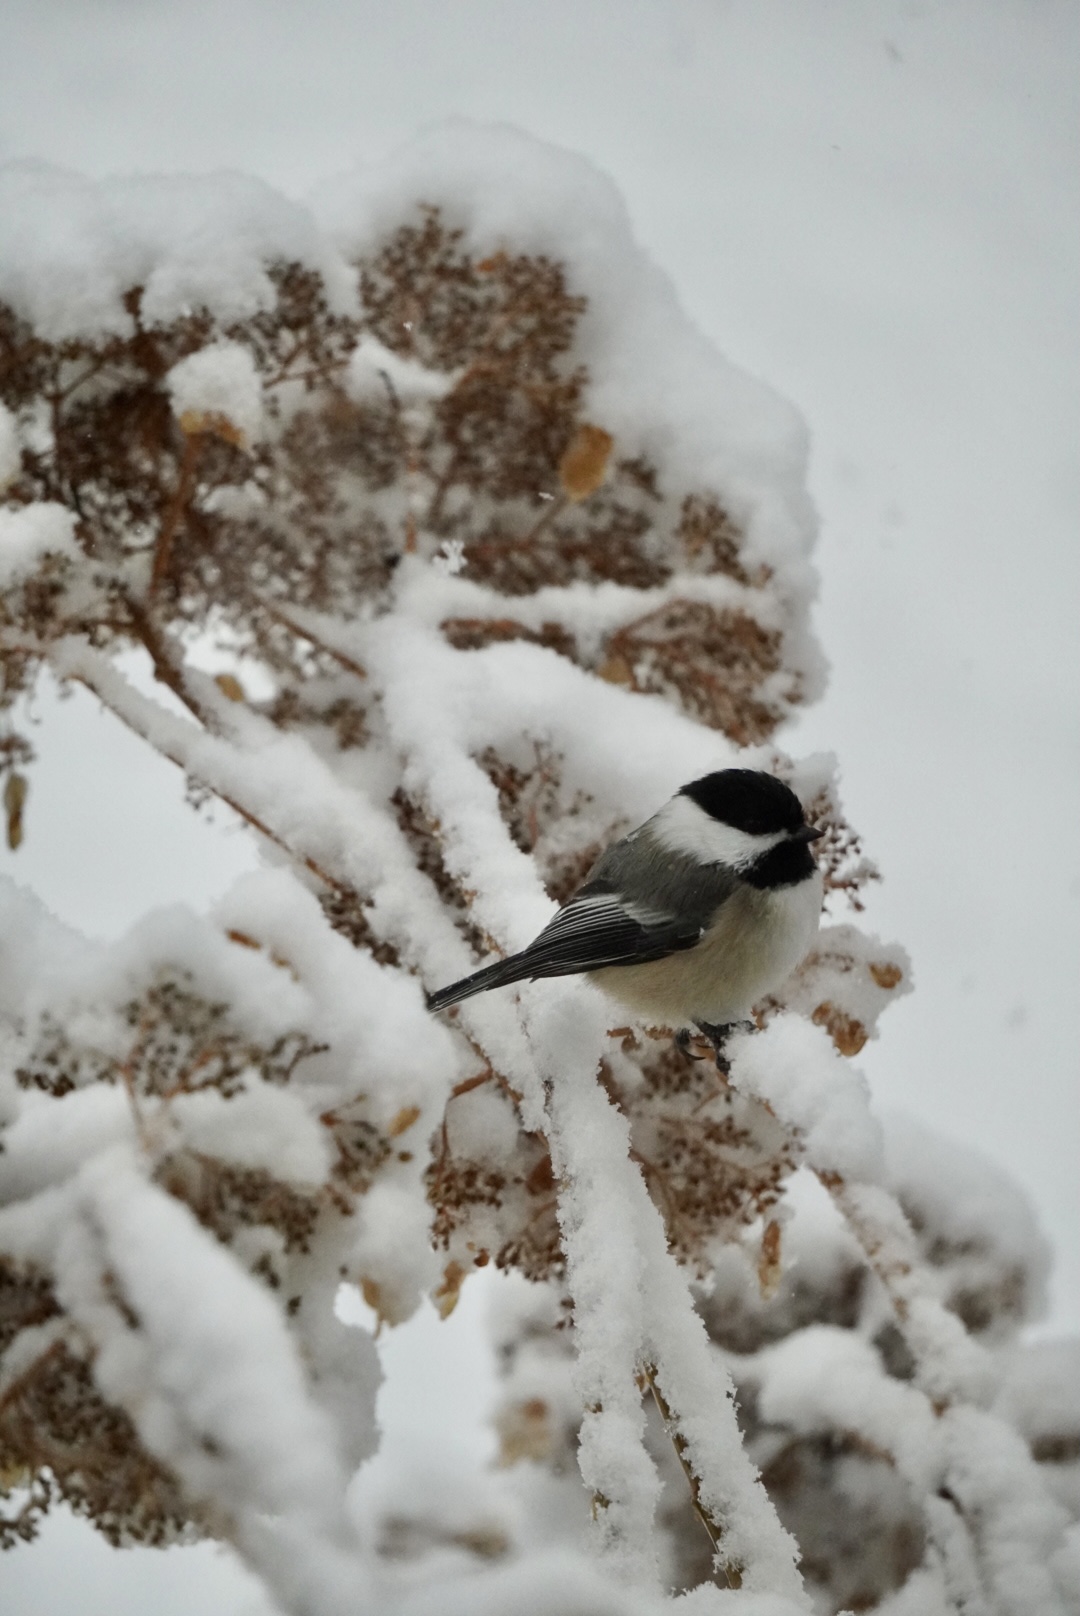
Black-capped Chickadee by Grace McCulloch
Look for a black cap and white cheeks. Listen for their “chick-a-dee-dee-dee call.”