Winter Trend: Increasing

Wild Turkey Winter Trend 1987–2025
Wild Turkeys, 1987–2025. The dark purple line shows the trend overtime predicted by our statistical model, while the shaded purple area shows where we are 95% confident the true trend lies. Gray points are the number of turkeys actually observed in participants’ backyards, averaged per observer.

What’s the Story?
Wild Turkeys might not be the first species that comes to mind when you think of backyard birds, yet many participants report them in their backyards! Today, they can be found in every part of New Hampshire, which makes it hard to believe that they were once hunted to local extinction.
After an unsuccessful reintroduction attempt in 1969 (cut short by a harsh winter), New Hampshire Fish and Game successfully reintroduced Wild Turkeys to the Connecticut River Valley in 1975. From there the population has steadily spread and grown.
Our statistical analysis shows the success of the reintroduction: a negative binomial regression shows a significant upward trend (β = 0.112 ± 0.008 SE, z = 14.88, p < 0.001).
This translates to reports of Wild Turkeys increasing by about 12% per year, even when accounting for changes in the number of Backyard Winter Bird Survey participants over time.
As you can see from the graph, there is year to year variation in Wild Turkey numbers. For example, in 2024 relatively few turkeys were reported. This was likely due to a cold, wet spring that reduced recruitment when many young birds did not survive.
Turkeys are highly adaptable birds. While harsh winter conditions (especially in northern New Hampshire) can limit their range, farms and other landscapes with abundant food have helped them thrive. They also forage for acorns and beech nuts, often leaving telltale scrapes in the snow where they’ve been searching for food.

Feeding Tips
- You’ll often see Wild Turkeys feeding below bird feeders.
- While Wild Turkeys enjoy cracked corn, we don’t recommend feeding them directly. Instead, consider your landscape and how you might provide natural food sources, such as oaks and beeches that produce hard mast.

In Your Backyard
- Watch for Wild Turkeys traveling in flocks, especially during fair weather. Their large tracks are also easy (and fun) to follow in fresh snow.
- Dense conifer stands provide excellent winter roosting sites. These trees not only insulate turkeys from the cold but also keep patches of ground beneath them snow-free, making foraging easier.

ID Tips
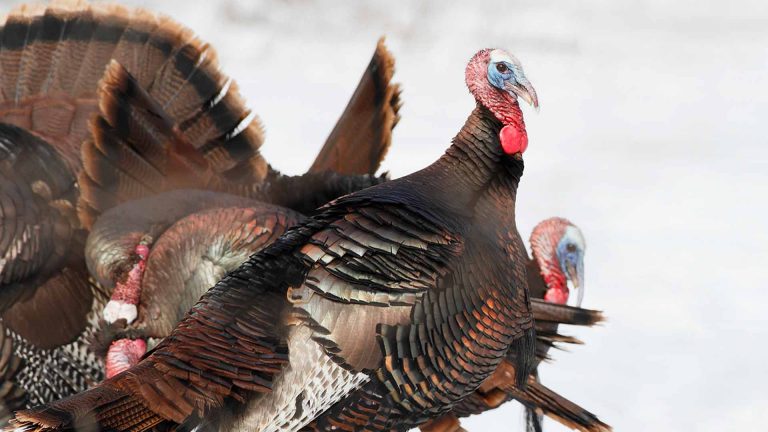
Wild Turkey by Len Medlock.
Look for this unmistakable large bird. It often travels in flocks.