
What’s the Story?

Feeding Tips

In Your Backyard

ID Tips
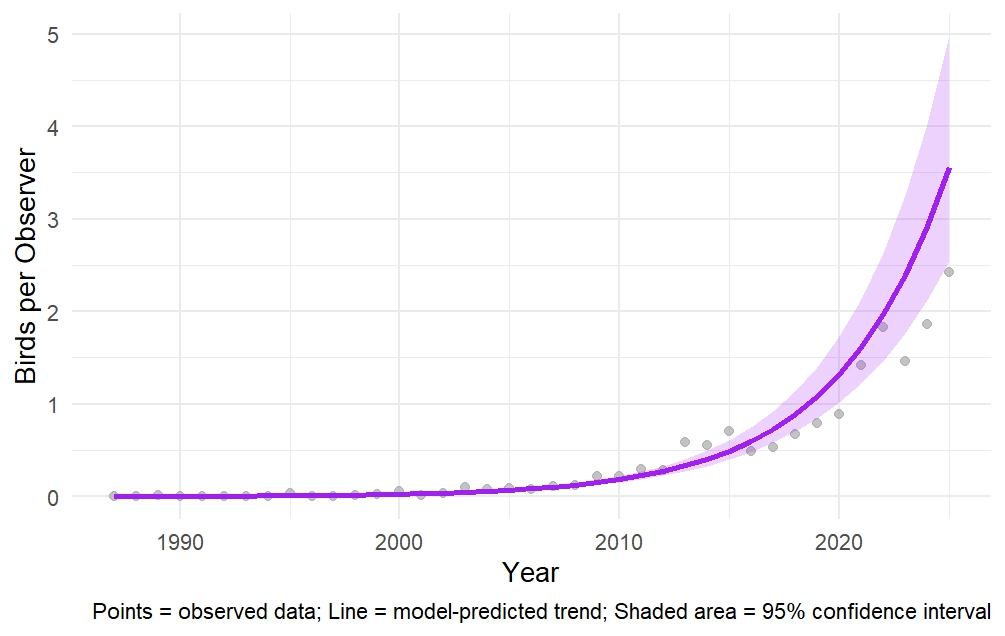
Eastern Bluebirds, 1987–2025.
The dark purple line shows the trend over time predicted by our statistical model, while the shaded purple area shows where we are 95% confident the true trend lies. Gray points are the number of bluebirds actually observed in participants’ backyards, averaged per observer.
Eastern Bluebirds represent one of New Hampshire’s most dramatic winter success stories. When the Backyard Winter Bird Survey began in 1987, bluebirds were rarely reported in winter. Today, numerous survey participants report them in their backyards.
Our statistical analysis confirms this rapid increase: a negative binomial regression shows a significant upward trend (β = 0.198 ± 0.009 SE, z = 22.7, p < 0.001). This equates with average counts of bluebirds rising by about 22% per year, even after accounting for changes in the number of survey participants over time.
This remarkable shift reflects both conservation success (such as nest box programs that boosted breeding populations) and broader environmental change. Warmer winters make it easier for bluebirds to remain year-round, while human landscaping practices, including planting fruiting trees and shrubs, provide critical winter food sources.
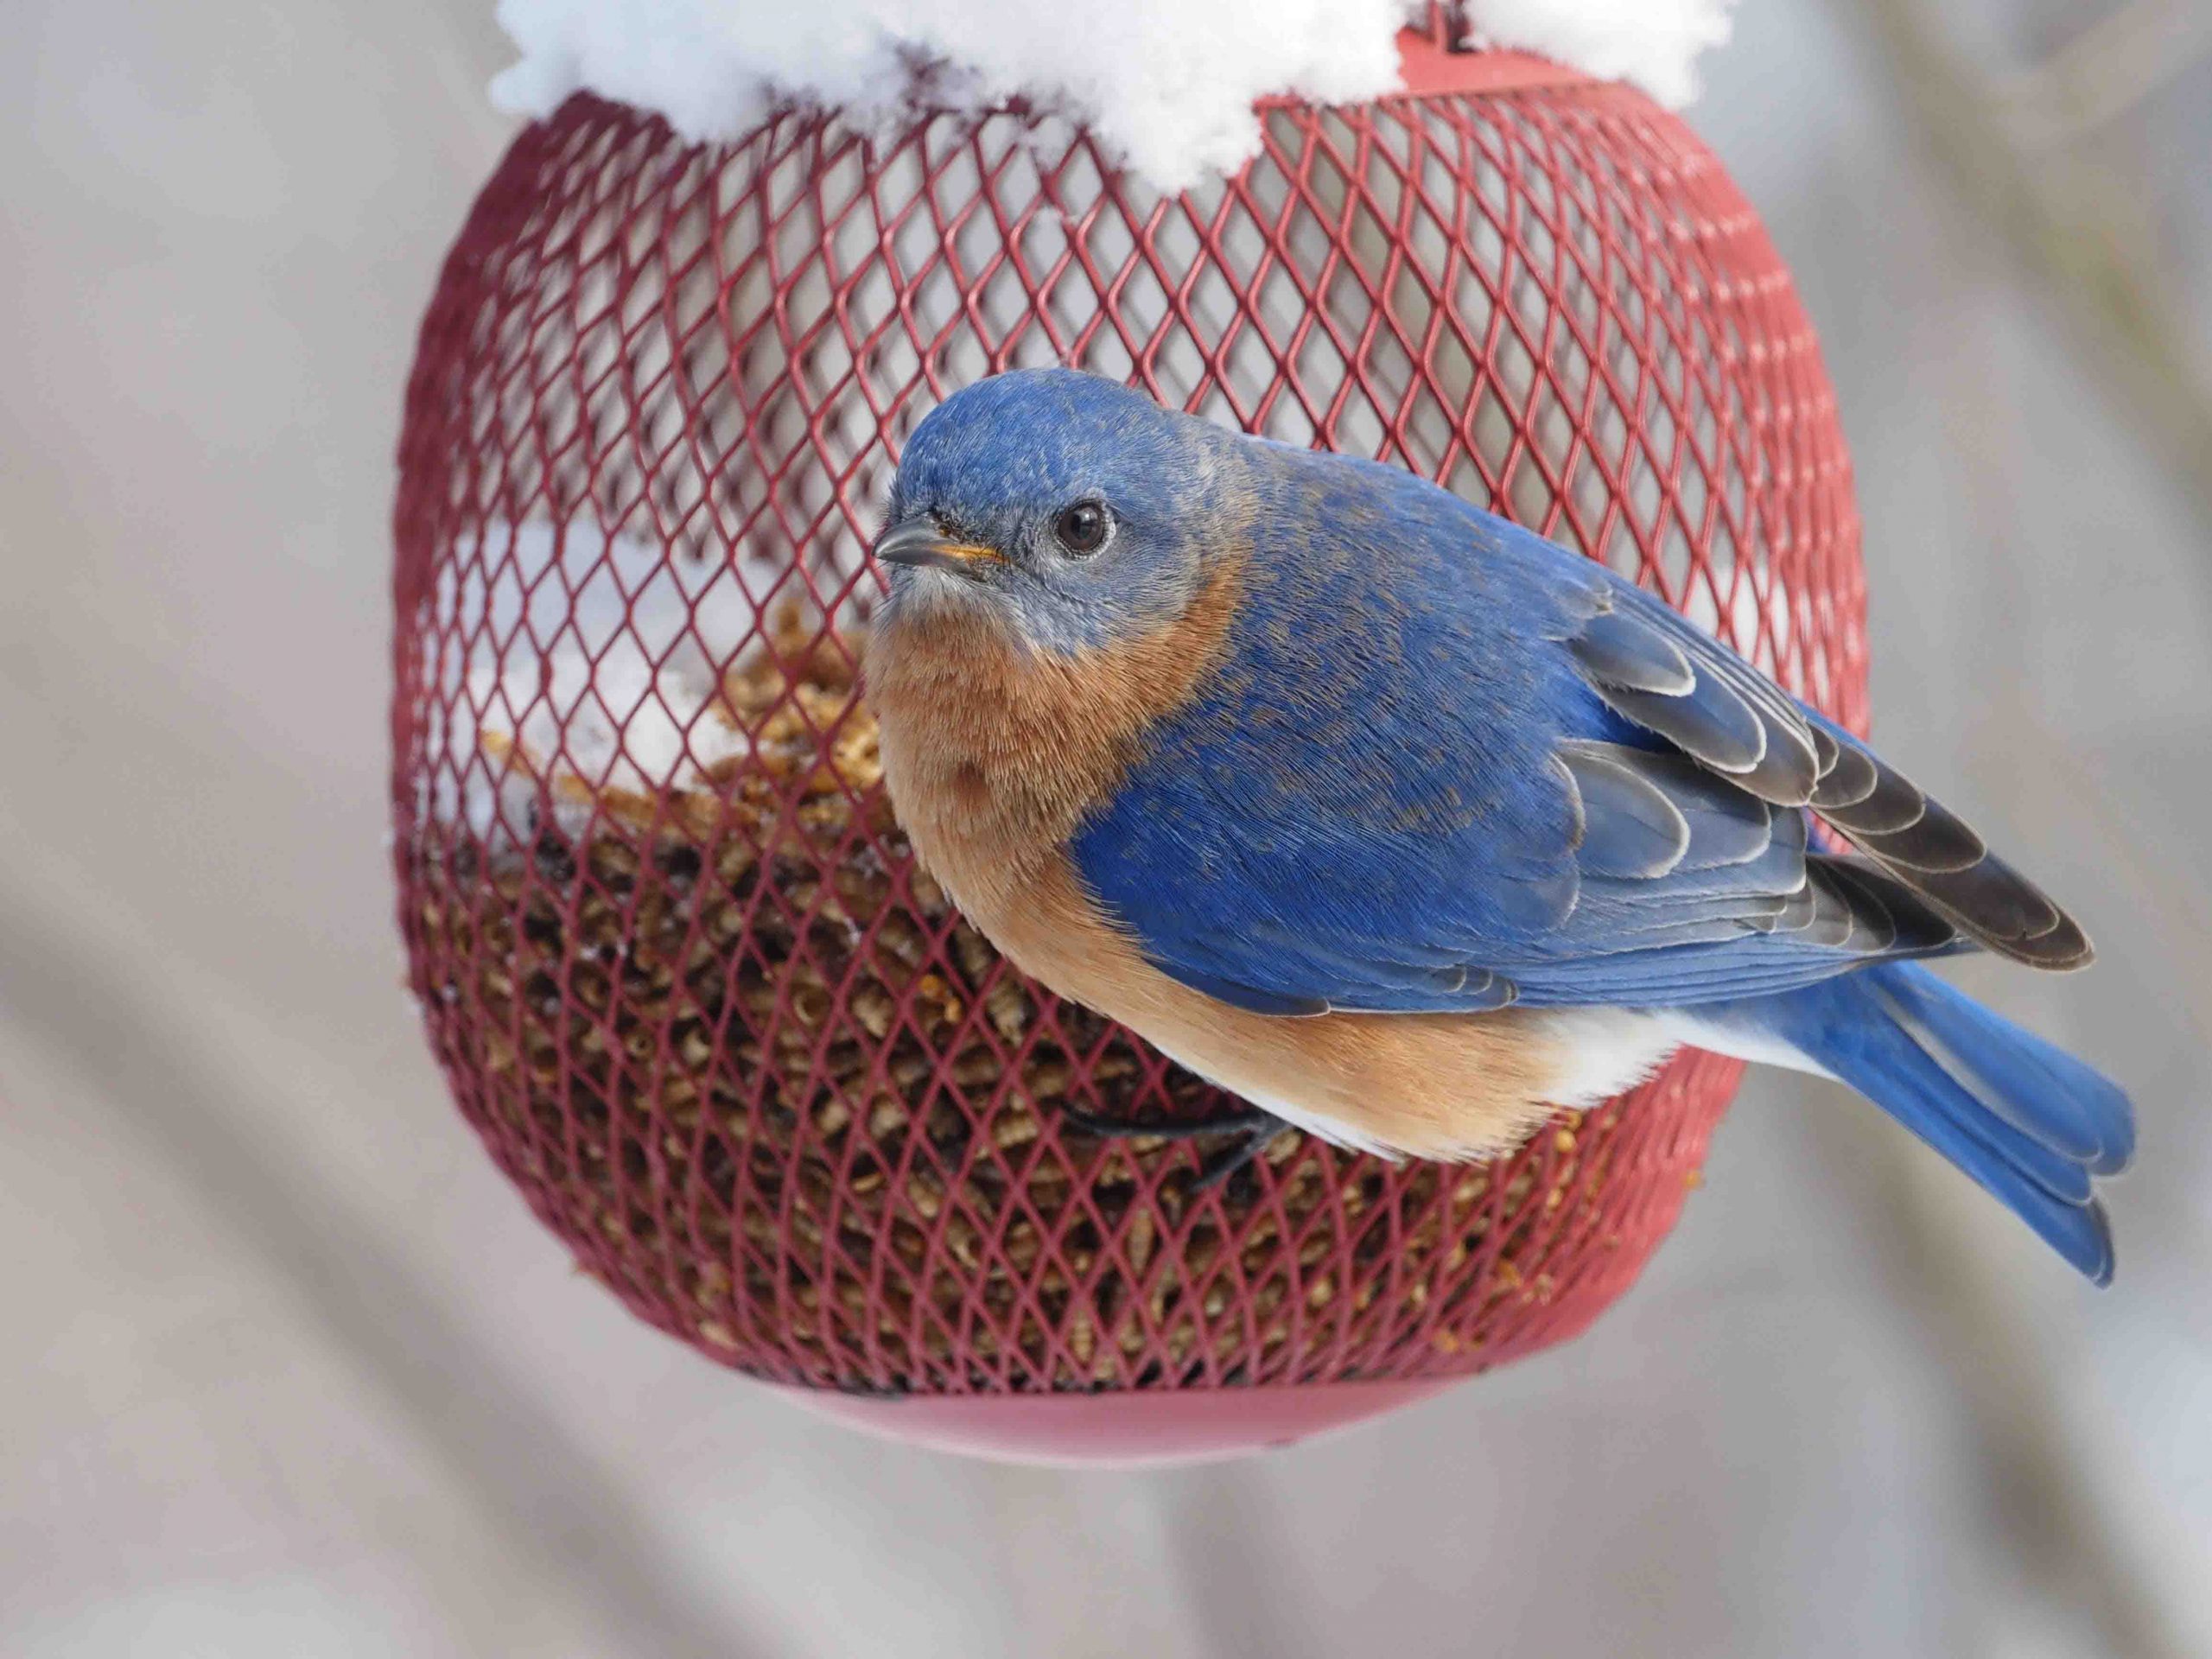
Male Eastern Bluebird by Caitlin McMonagle.
Male Eastern Bluebirds have bright blue on the back and head with orange on the throat and breast.
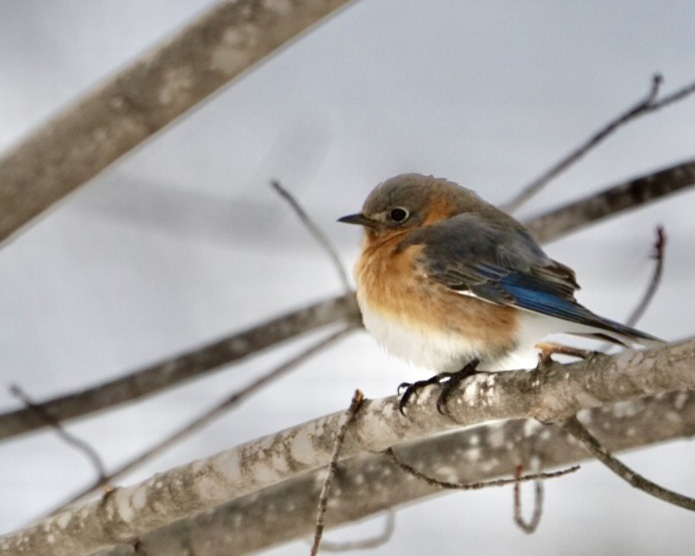
Female Eastern Bluebird by Grace McCulloch.
Female Eastern Bluebirds have a similar pattern to the males but are duller in coloration overall.
Observed Data (gray points):
The average number of birds counted per participant each year.
Model-Predicted Trend (dark purple line):
A line from a statistical model that estimates the overall trend in bird numbers over time, smoothing out year-to-year fluctuations.
95% Confidence Interval (shaded purple area):
The range around the predicted trend where we are 95% confident the true trend lies. Gray points inside this band indicate observations that are consistent with the predicted trend.
Other Stats You Might See in the Story:
The Takeaway: These graphs show how bird populations are changing over time. The model helps us see the overall trend and the confidence interval shows how certain we are about that trend.